Research you can use
Evidence, interpretation, and a practical testUpdated October 26, 2026. Benchmark review October 23; post examples and video checked October 26. For B2B founders and marketing teams deciding what to publish through a leader's profile and a company page.
A founder deciding between a screen-share video and a document post needs more than a list of formats ranked by likes. The choice depends on the account, the job of the post, and what the material helps a buyer understand.
The current research gives a reason to test multi-image posts and documents alongside text and video. It also shows why personal profiles and company pages need separate benchmarks. None of these studies establishes a post format that reliably creates buyer trust or revenue.
The practical starting point: Publish an answer to a buyer's real question, choose a format that makes the answer easier to understand, and compare the result with your own similar posts. Record relevant conversations separately from engagement. LinkedIn's current guidance favors useful professional content and discourages automated engagement and repetitive, low-substance posting.
What deserves your attention?
| Finding | What it changes for a B2B publisher |
|---|---|
| LinkedIn is updating how it understands professional interests | Write around a recognizable reader and decision; a broad hook still needs a specific payoff |
| Multi-image posts lead one personal-profile engagement comparison | Test a sequence that explains something useful; do not add slides merely to change the format |
| Personal and company benchmarks differ, sometimes in opposite directions | Keep separate reporting for the founder's profile and the business page |
| Link associations differ by account type | Measure resource visits and useful inquiries before hiding every link in a comment |
| Buyers report using thought leadership to vet vendors | Publish evidence of how the leader thinks about a real business problem |
What is LinkedIn changing?
LinkedIn's March feed update describes systems that better interpret professional interests and content meaning. Its accompanying engineering explanation describes both post information and members' profiles and engagement histories as inputs. These documents support audience relevance. They do not prescribe a universal hook formula or a maximum number of topics.
The platform also says it is reducing repetitive, low-substance posts and engagement bait, including prompts such as "comment to agree." It describes action against engagement pods and automated comments. This is a stronger reason to avoid those practices than a creator's claim that a particular comment length unlocks distribution.
For an executive, choose the subjects on which they can help the intended buyer make a decision. A finance leader could discuss the cost of an implementation delay and how to evaluate a forecast. Those subjects can serve the same audience without requiring identical wording or a rigid topic quota.
Which formats deserve a test?
Multi-image posts and documents are useful candidates when the material benefits from a sequence. Video still has a clear job when a person needs to demonstrate a workflow or explain a judgment in their own voice.
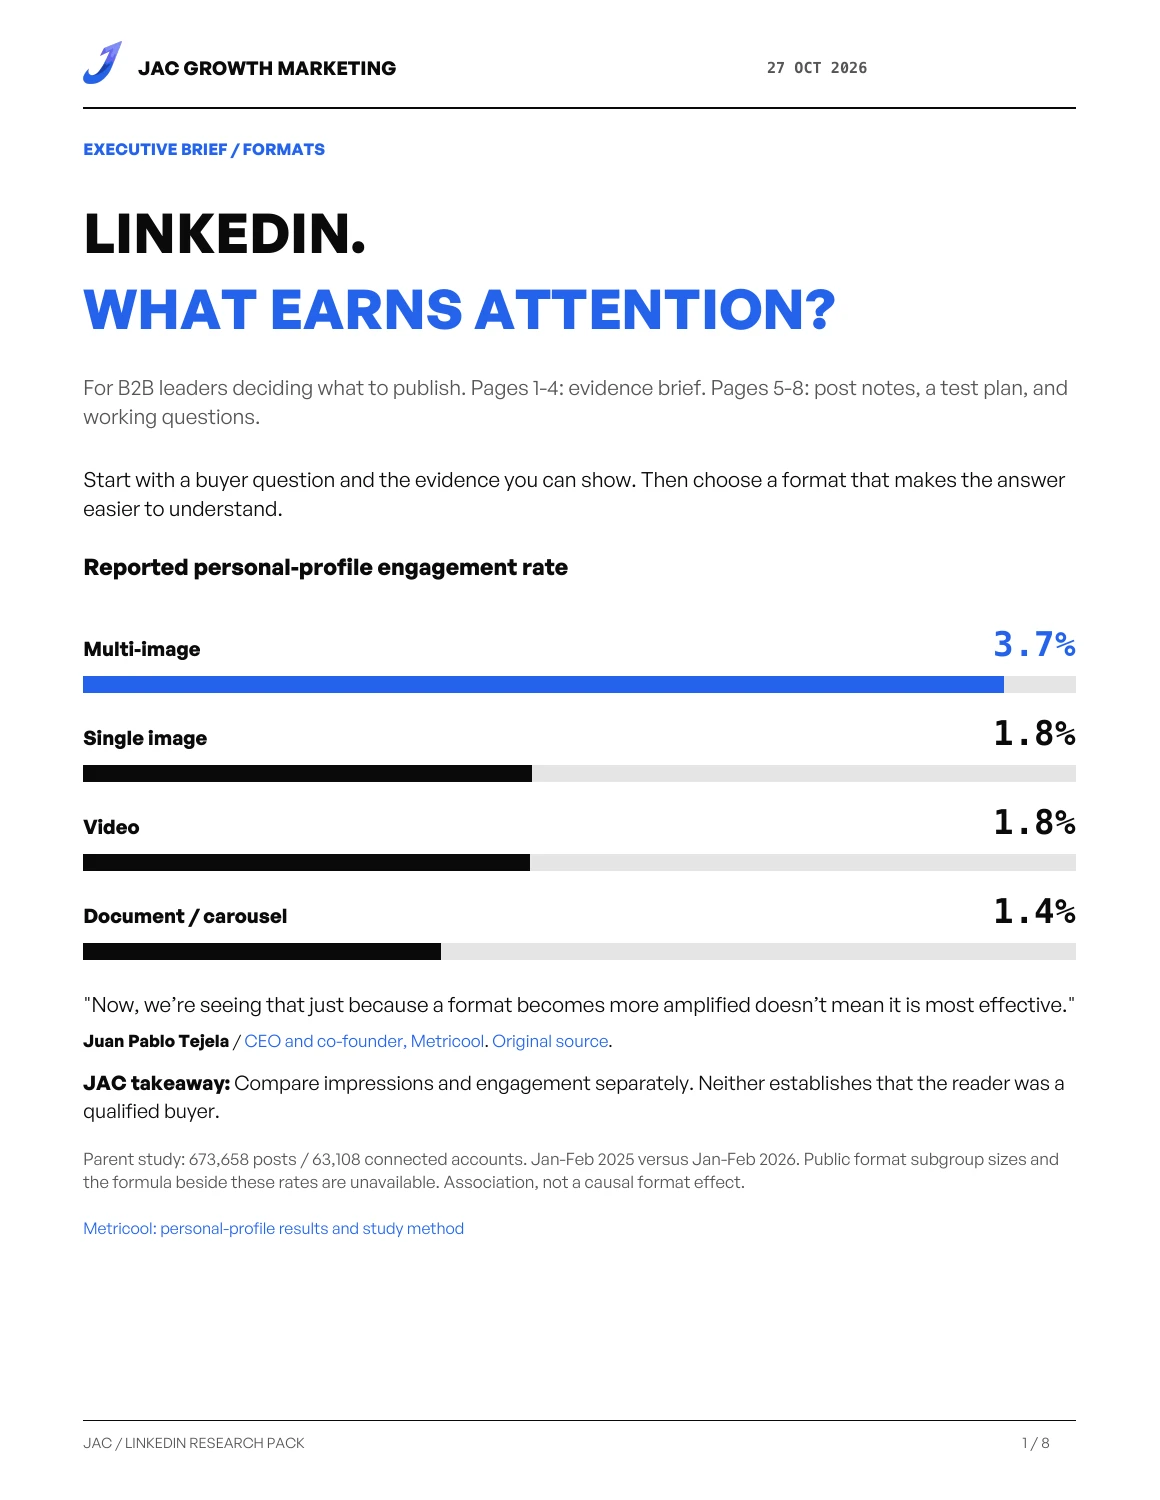
In Metricool's personal-profile comparison, multi-image posts have a reported engagement rate of 3.7%, compared with 1.8% for single images, 1.8% for video, and 1.4% for documents/carousels. Its format summary reports about 1,451 impressions per personal-profile document post, compared with about 606 for video.
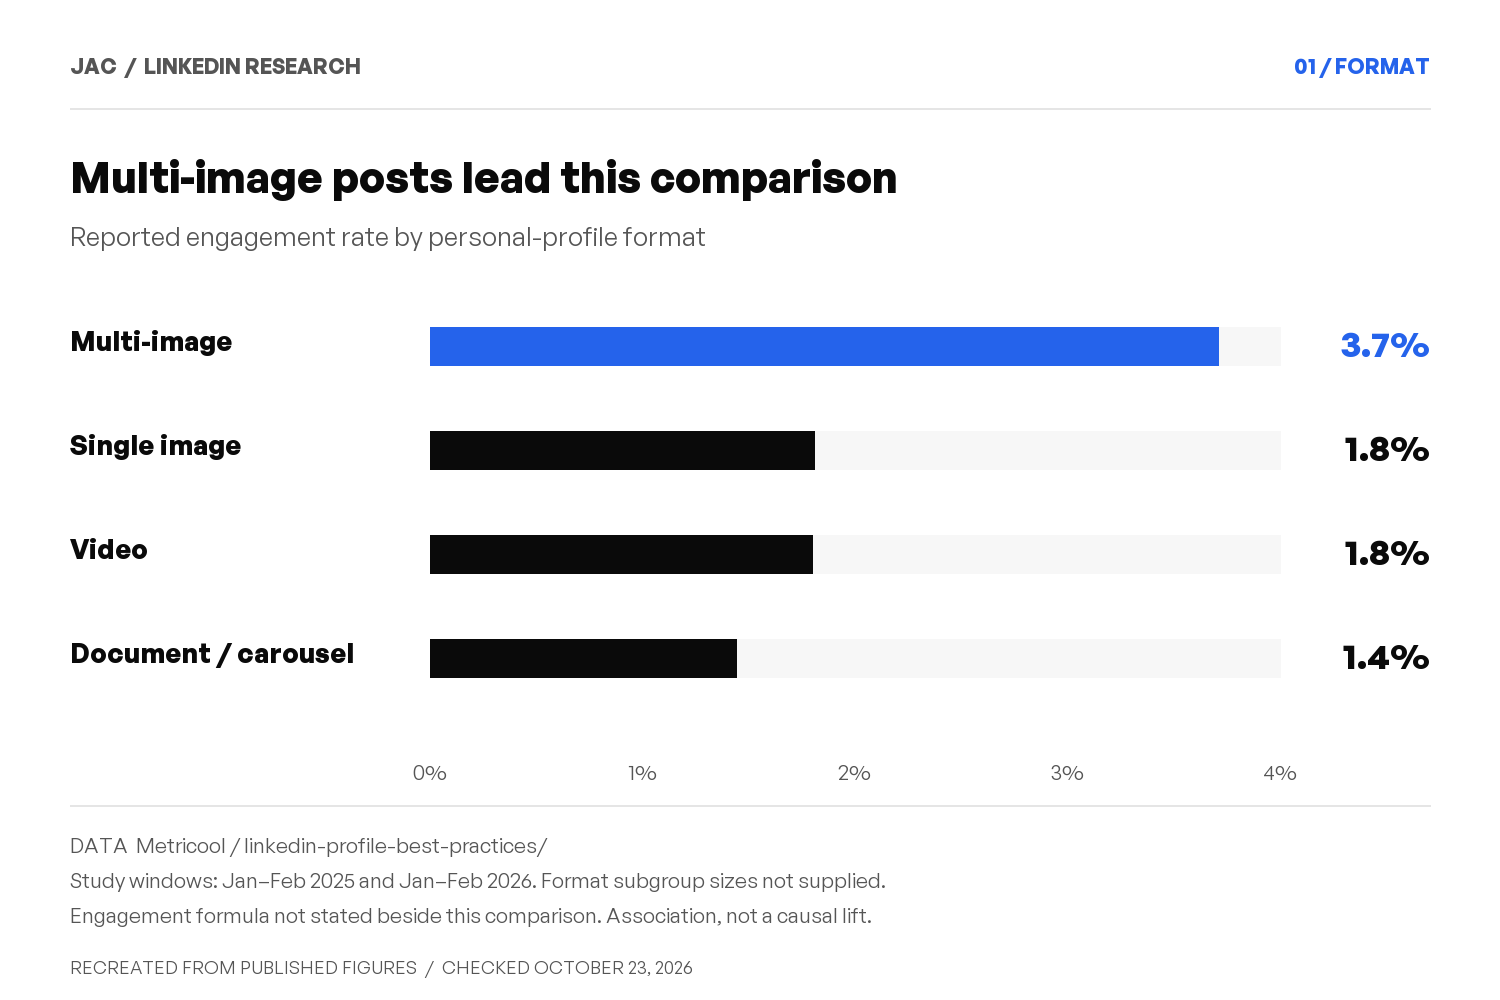
Recreated from Metricool's public study summaries. The parent study covers 673,658 posts from 63,108 connected accounts, comparing January–February 2025 with January–February 2026. Format subgroup counts and the engagement formula are not supplied beside this public comparison. These are associations, not expected results for your account.
The distinction matters: a format can lead on impressions without leading on engagement rate. The numbers also do not tell us whether a buyer understood the explanation or contacted the author.
Choose the format after choosing the evidence:
| Material you have | Format worth testing | What the reader should get |
|---|---|---|
| One decision that needs a short explanation | Text | A clear answer and the condition that changes it |
| A real interface or result that needs annotation | Single image or screen-share video | The exact detail to inspect and why it matters |
| A comparison with distinct steps or options | Multi-image post or document | A sequence the reader can follow without leaving the post |
| A leader explaining an uncertain tradeoff | Informal native video | The reasoning behind the decision, with visible evidence where possible |
For a report walkthrough, a two-minute screen share is a sensible creative choice when it lets the author point to the chart and explain its implication. That length is an editorial choice, not an algorithm requirement. Use readable captions and enlarge the chart enough to work on a phone.
In Metricool’s study announcement, CEO Juan Pablo Tejela makes a useful distinction between format visibility and effectiveness:

“Now, we’re seeing that just because a format becomes more amplified doesn’t mean it is most effective.”
This is the publisher’s interpretation of its format findings, not a controlled test of algorithmic amplification.
Should the founder's profile lead distribution?
A leader's profile gives readers a named person to respond to. The company page gives the business a place to publish its research and product explanations. The evidence supports measuring each separately rather than assuming one always wins.
AuthoredUp's account-type comparison examines 704,259 personal-profile posts and 189,909 company-page posts from July 2025 through June 2026. It includes original posts with more than 100 impressions and engagement rates below 10%.
Personal posts have higher median impressions: 1,006 versus 659. Company posts have a slightly higher median engagement rate: 2.6% versus 2.4%. That is a useful warning against treating reach and engagement rate as interchangeable.
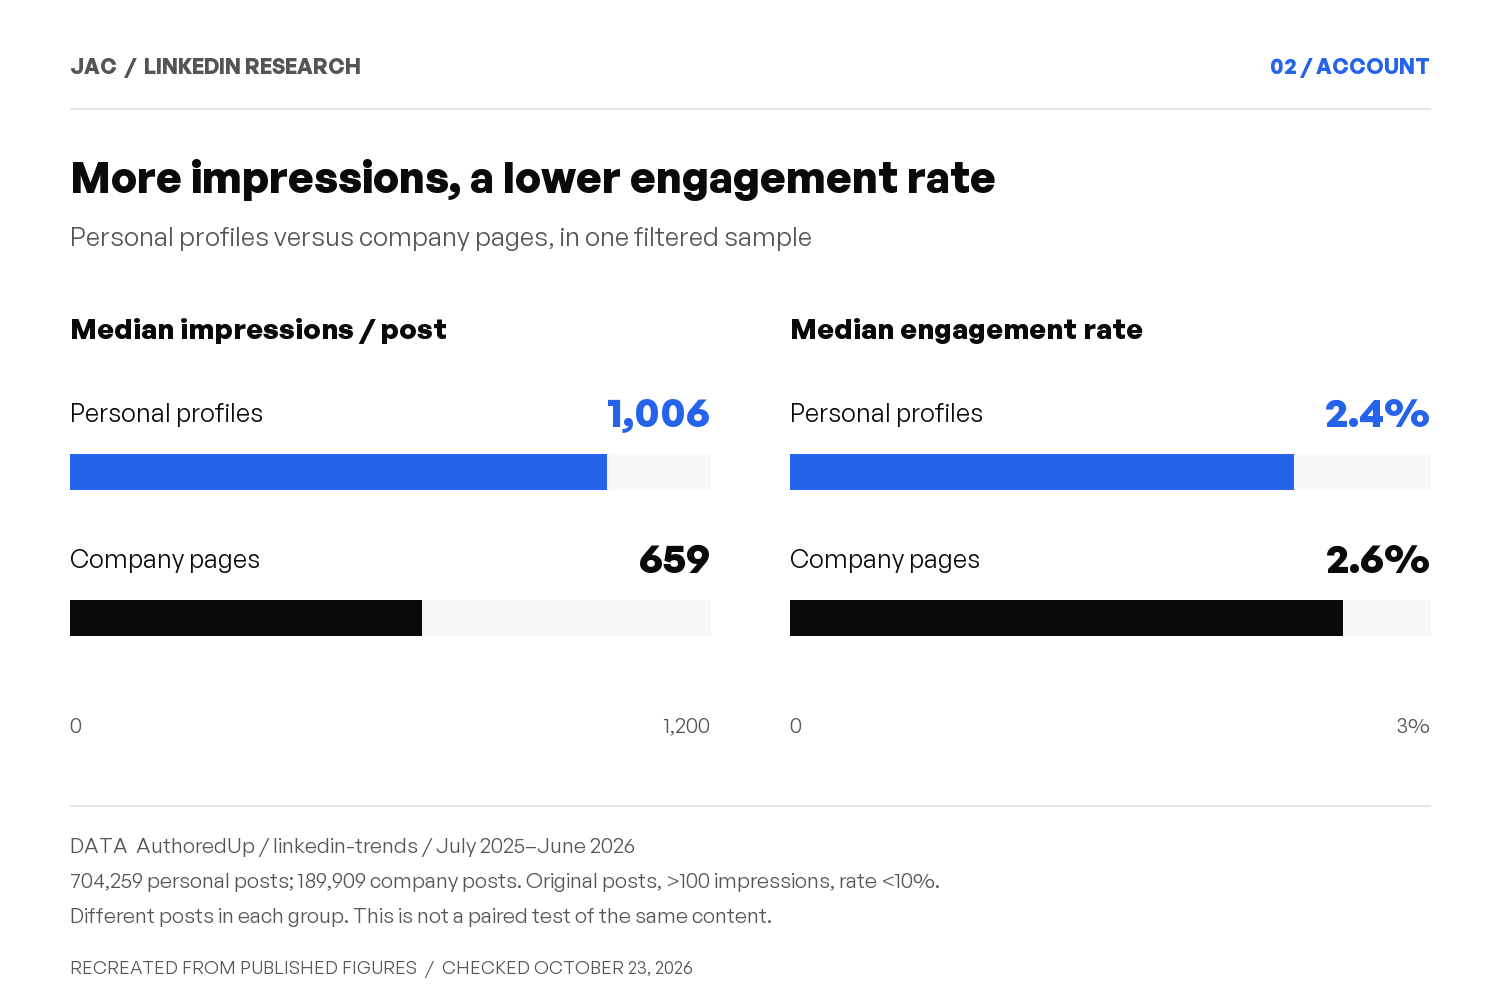
Recreated from AuthoredUp's published medians. The two account groups contain different posts; this is not a paired test of identical content. The study's filters exclude low-impression posts and high-engagement outliers.
Metricool's separate study reports a 63% higher average engagement rate for personal profiles. That does not invalidate the AuthoredUp medians. The datasets use different periods and populations, and an average is not a median. Their engagement definitions also cannot be assumed identical.
For a small business, publish the research through the company, then let the leader explain which finding changed a decision or how they would apply it. Copying the same announcement to both accounts misses that opportunity. This is an editorial recommendation, not a measured distribution advantage.
Here is a constructed application of the chart above. Neither example is a published post or a measured result.
| Surface | Opening and asset | What the body delivers |
|---|---|---|
| Company page | "Personal profiles lead on impressions in this sample. Company pages have the higher median engagement rate." Attach the comparison chart. | Explain the sample filters and the two metrics. Link the report so readers can inspect the evidence. |
| Leader's profile | "This chart is why I'd measure a founder's profile and the company page separately." Use a brief screen-share walkthrough. | Point to the reversal between metrics, then explain which response would justify investing more time. Invite a specific question about the comparison if one would help the reader. |
Are external links hurting posts?
There is no defensible universal answer from these studies. Account type changes the comparison, and more impressions may not be the goal of a resource post.
Metricool's public link analysis reports company-page posts with links at 51% more impressions and 41% more interactions relative to its comparison baseline. Personal-profile link posts show 27% fewer impressions and 20% fewer interactions.
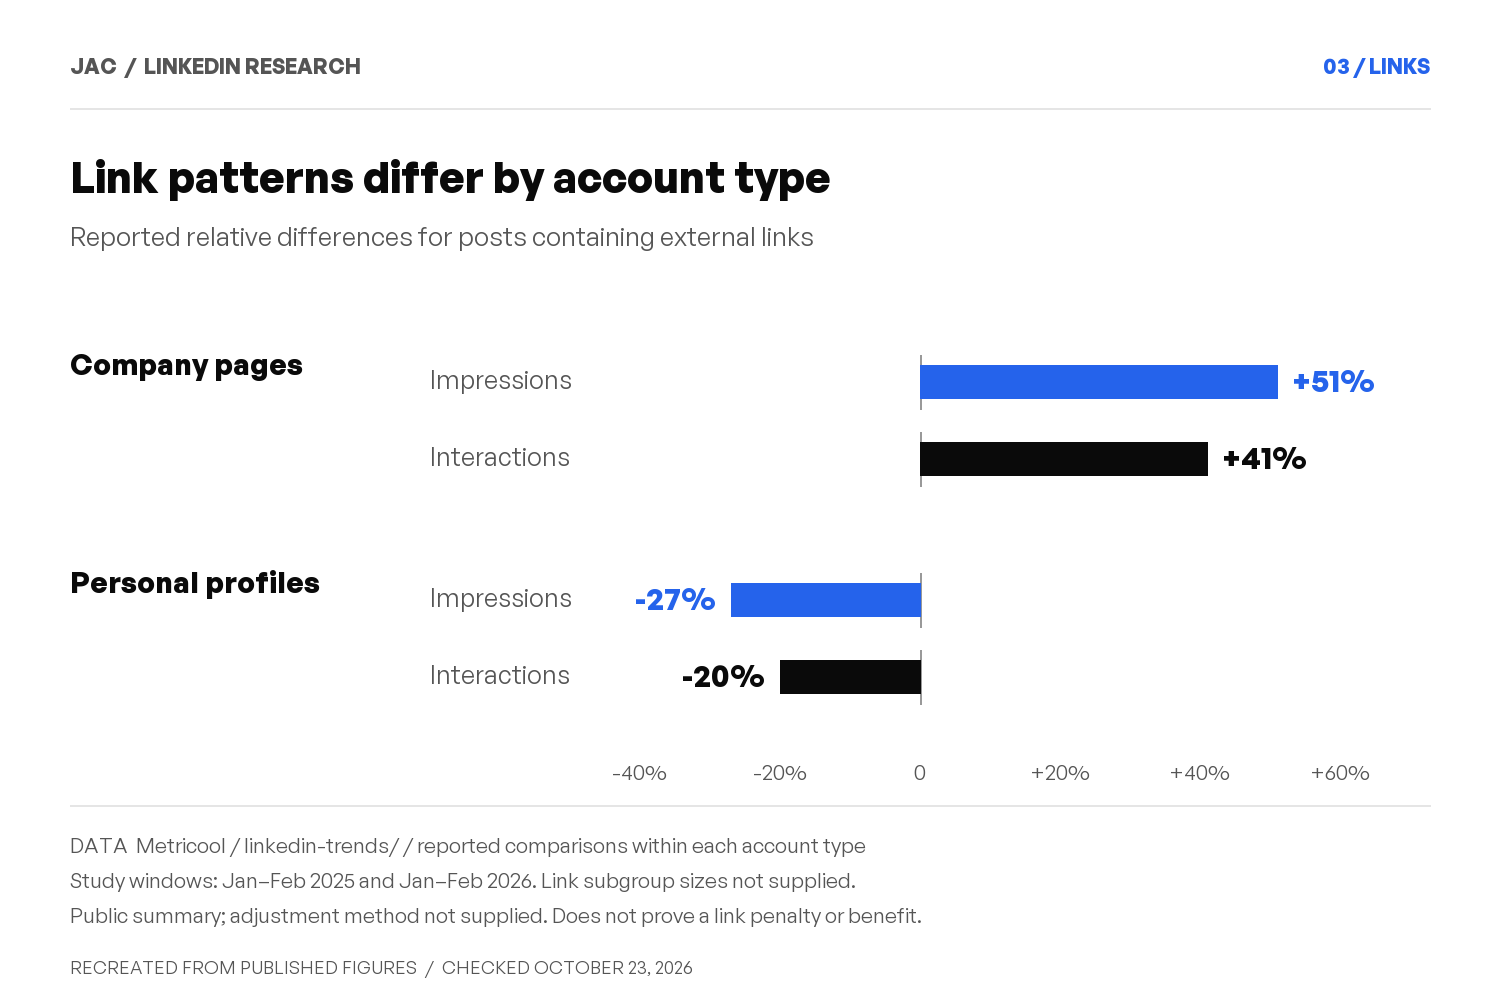
Publisher-reported relative differences within each account type. The public summary does not supply link subgroup sizes or an adjusted model. Topic and publisher differences may explain part of the pattern. This does not establish an algorithmic link penalty.
If a post's job is to help someone use a report, a visible link may be worth including even when reach is lower. Track tagged visits and completed actions. Compare similar resource posts on the same account before adopting a rule about link placement.
Clicks and visible reactions capture different actions. Neither establishes that the visitor was a qualified buyer.
What should a hook promise?
Give the intended reader a reason to continue, then deliver on it. The research retrieved for this edition does not establish a winning first-line length, opening phrase, or punctuation pattern.
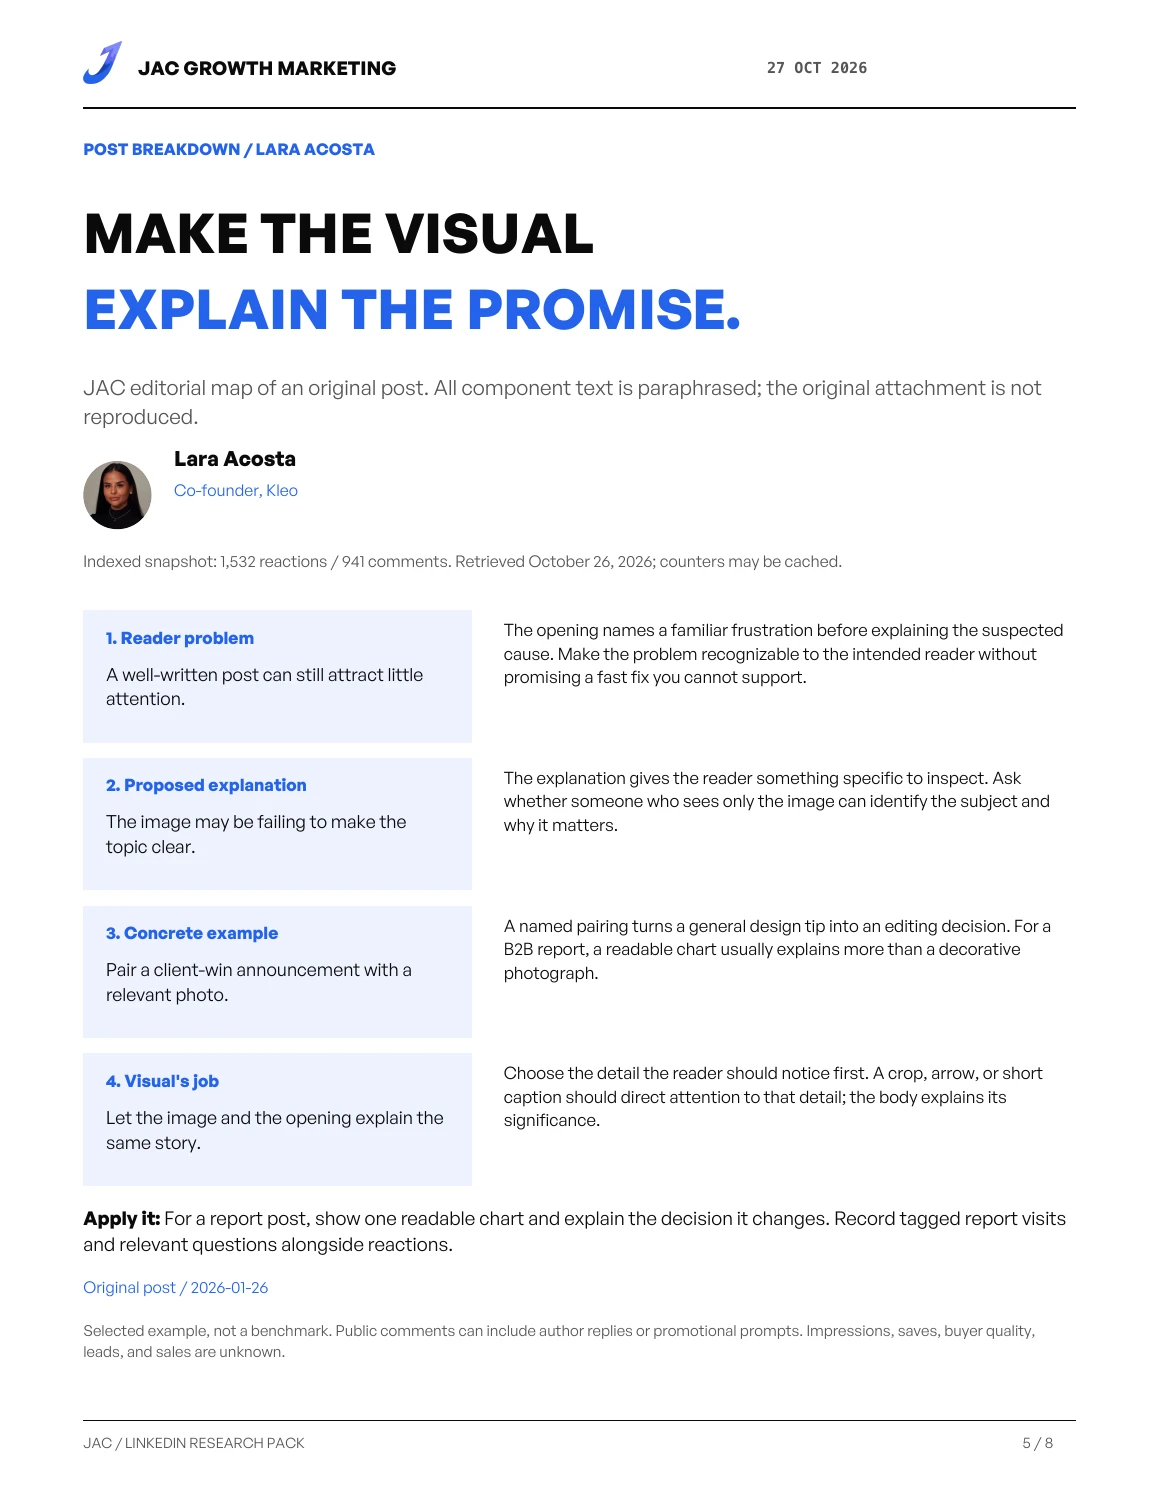
Lara Acosta's explanation of using text and visual hooks together gives the image a specific job:

"Capture attention with the visual hook in the image. Retain it with a visual hook in your written copy."
For a B2B leader, the image should make the subject recognizable or expose useful evidence. If the opening promises a product tradeoff, show the relevant screen or comparison and explain what the reader should inspect. A decorative portrait cannot supply the missing explanation. This is practitioner advice, not evidence that two hooks double reach.
In an original post about executives publishing on LinkedIn, Dave Gerhardt gives the author a concrete editorial decision:

“Shrink down the focus of what you write about. What's the one topic it would be most valuable for you to be known for?”
These are practitioner perspectives, not independent experiments. Together they suggest a useful editing test. Can the reader recognize their problem in the opening, and does the rest of the post answer it?
The examples below are constructed teaching examples. They are not published posts or measured winners.
| Opening approach | Example | What the body must deliver |
|---|---|---|
| Name the decision | "Your founder wants to post more. Start by deciding which buyer question they can answer." | A way to select a useful question and identify the leader's real evidence |
| Point to an artifact | "This chart makes personal profiles look stronger. The engagement-rate comparison tells a different story." | The actual chart, account filters, and explanation of the two metrics |
| Offer a practical distinction | "A product walkthrough and a launch announcement need different video scripts." | A worked comparison that helps someone write either script |
| Ask a diagnostic question | "Would a buyer learn how you make a decision from your last five posts?" | Specific things to inspect, with an example of useful reasoning |
What can we learn from posts with visible engagement?
The two maps below examine original posts that attracted public reactions and comments. They show how an opening connects to its explanation and a possible reader action. The components are paraphrased and highlighted for teaching; these are not native screenshots or copies of the authors' complete posts.
Visible response helps identify examples worth inspecting. It cannot tell us which component caused the response, whether the readers were buyers, or how the posts performed against each author's usual results. The maps include a specific adaptation for a B2B publisher and advice to leave behind.
Lara Acosta / original post 2026-01-26
Make the visual explain the promise
Indexed snapshot: 1,532 reactions / 941 comments
Editorial map / paraphrased components
A well-written post can still attract little attention.
The image may be failing to make the topic clear.
Pair a client-win announcement with a relevant photo.
Let the image and the opening explain the same story.
Borrow: Choose the point the reader should notice in the image. Make that point visible in the crop, annotation, or caption, then explain its relevance in the body.
Leave behind: Do not borrow the unsupported 40% statistic, a guaranteed reach promise, or a generic question purely to increase comments.
Apply it: For a report post, show one readable chart and explain the decision it changes. Record tagged report visits and relevant questions alongside reactions.
Inspect the original postDave Gerhardt / original post 2026-08-06
Give a short post a concrete argument
Indexed snapshot: 310 reactions / 123 comments
Editorial map / paraphrased components
Put customer understanding ahead of tool fluency.
Inspect the customer's work, constraints, and competing demands.
Use one unanswered customer question as the next brief.
An argument can be useful without an added graphic.
Borrow: State the decision clearly, then show what acting on it involves. Specific questions give a reader more to use than a broad claim about knowing the customer.
Leave behind: Do not copy the original contrast opener or assume a recognized creator's response will transfer to a new account.
Apply it: Answer one of those customer questions with a real example. Watch for comments that describe the same problem and requests for more detail.
Inspect the original postIndexed public snapshots retrieved October 26, 2026, via the original-post URLs. Counters may be cached. Comments include any author replies or promotional prompts. Impressions, saves, audience quality, leads, and sales are unknown. These two selected posts do not establish a benchmark.
Which video is worth watching?
Acosta's live content-planning session is useful because it shows the questions behind a post, rather than only displaying a finished template. A software founder works through what they want to be known for, what their intended readers need, and what experience can support the content.
Watch a founder work out what to publish
Lara Acosta / 23 minutes / published January 22, 2026
- Notice how technical expertise becomes a reader's practical question.
- Separate the author's experience from a writing template or an AI-generated draft.
Watch on YouTube instead. Includes a Kleo product demonstration.
Watch how a broad technical subject becomes a question someone else cares about. Then write one buyer question and the evidence you can use to answer it. Keep the resulting draft in the author's own voice. The session demonstrates a product the presenter co-founded, and its revenue headline and algorithm claims are not findings adopted by this report.
Which topics can build buyer confidence?
Start with a decision the buyer needs to make and something the leader can explain from verified experience or evidence. Useful material includes a product tradeoff, a mistaken assumption in a benchmark, or a practical answer to a recurring implementation question.
The 2025 Edelman–LinkedIn thought leadership report provides buyer-side context. In its US survey of 1,934 business executives, fielded March 17 through April 3, 2025, 55% of hidden decision-makers say reviewing thought leadership is an important part of vetting potential vendors. These are stakeholders such as finance or procurement leaders who influence a purchase without being the main product expert.
Among hidden decision-makers, 91% associate high-quality thought leadership with helping them understand a challenge or recognize an overlooked need. The survey covers thought leadership across formats and channels. It does not show that a particular LinkedIn post produced a sale.
Use that as a topic filter. What can the author help a buyer notice before they make an expensive decision? Show the reasoning and cite outside evidence. The founder-content guide explains how to gather a leader's ideas and voice before drafting. If an example involves a client, obtain permission and verify the result before using it.
For visuals, show the object the claim depends on. An annotated screenshot can explain a workflow. A recreated chart can expose a misleading comparison. A decorative stock photo supplies neither. Keep source attribution beside a chart and label recreations so readers can inspect the original.
Which advice deserves less weight?
Some advice is unsupported, some depends on the account, and some is explicitly discouraged by the platform. Those are different reasons to change a practice.
| Claim or practice | What the evidence supports | A better decision |
|---|---|---|
| Every account should avoid external links | Metricool reports opposite link associations for profiles and pages | Judge a resource post by useful visits as well as reach |
| LinkedIn requires exactly two topics | A recent practitioner post recommends this; the retrieved official guidance publishes no such limit | Keep a clear audience and enough evidence to discuss each subject credibly |
| More weekly posts guarantee more reach per post | Buffer's public headline and linked analyst results disagree about reach | Choose a sustainable cadence and inspect your own comparable posts |
| Replying creates a guaranteed 30% engagement lift | Buffer observes an association; timing and the metric prevent a causal conclusion | Answer worthwhile comments because the conversation helps the reader |
| Questions and comment prompts are interchangeable | A genuine question can invite useful discussion; LinkedIn discourages engagement bait | Ask for experience or a specific judgment when the answer matters |
| All AI-assisted writing is penalized | The retrieved platform statements target low-substance content and inauthentic engagement, not every use of writing assistance | Check the facts and preserve the author's actual judgment |
Richard van der Blom's October 21 post recommends a maximum of two topics and describes other precise algorithm rules. It promotes a forthcoming report. The underlying method for those specific thresholds was not available in the retrieved post. Treat them as claims to test, rather than platform requirements.
The cadence discrepancy is also material. Buffer's public frequency article reports higher impressions per post with more frequent posting. Its linked analyst notebook reports declining reach per post in its within-account model. Impressions and reach are not interchangeable, and the retrieved pages do not reconcile the difference. This edition excludes the headline reach increments from its recommendations.
The original comment-reply analysis is more explicit about limits: it covers 72,211 posts, of which 5,659 have replied comments. Its engagement metric includes comments, and it lacks timestamps that would establish whether replies preceded better performance. A reply habit is reasonable; a guaranteed percentage return is not.
What should you test first?
Start with a small test you can sustain alongside the work that gives the leader something useful to say. The following four-week plan is an editorial starting point, not an evidence-backed optimum or a statistically conclusive experiment.
Choose two buyer questions. Publish two posts per week, using text for some explanations and an evidence-led image, document, or video where the material benefits from it. Record the format and the question each post answers. The single-post playbook provides a source brief for that first draft. Do not invent a story to fill the calendar.
Before publishing, choose the primary outcome. A report post might aim for relevant visits; an explanation might aim for substantive questions from the intended audience. Capture impressions and available engagement at the same elapsed intervals, such as 72 hours and seven days. These intervals are measurement choices, not LinkedIn distribution limits.
| Track | What it can tell you | What it cannot establish alone |
|---|---|---|
| Impressions and available member-reach data | How widely a post was shown under those metric definitions | Whether the viewers were buyers or understood the point |
| Substantive comments and relevant DMs | Which questions or objections the post brought forward | The opinions of everyone who saw it |
| Tagged resource visits and completed actions | Which visible next steps followed the post | Every private share or later influence on a purchase |
| Qualified inquiries with a source note | Whether an opportunity mentioned the material | That the post caused the opportunity |
At the end, compare medians within the same account and inspect the posts behind them. A small set helps identify a direction to explore. It cannot isolate a format effect from topic, timing, or execution.
If a leader has useful experience but struggles to turn it into a clear post, the Founder-Led Content offering explains how that work can be supported. The same questions in this report apply whether the content is produced internally or with help.
Sources and scope
This edition combines official LinkedIn statements, publisher analyses of connected-account data, a US buyer survey, and selected public expert posts. It is a checked synthesis, not original platform-wide research. A report's publication year does not mean every post in its dataset was published that year.
Metricool's full study remains behind an email form; this edition uses its retrieved public summaries. AuthoredUp's comparisons use their stated sample filters. Buffer's open analyst notebooks make several limitations visible that short summaries omit. The source register retains those distinctions and excludes unresolved benchmark figures.
The practitioner posts are selected examples of ideas worth examining. They are not a representative sample or a leaderboard of high-performing posts. Public reaction counts cannot establish impressions, saves, leads, or sales, so no such outcomes are inferred here.

Research and analysis by Jared Castronova
Founder of JAC Growth Marketing. Helping B2B brands with AI search, SEO, and founder LinkedIn content.